

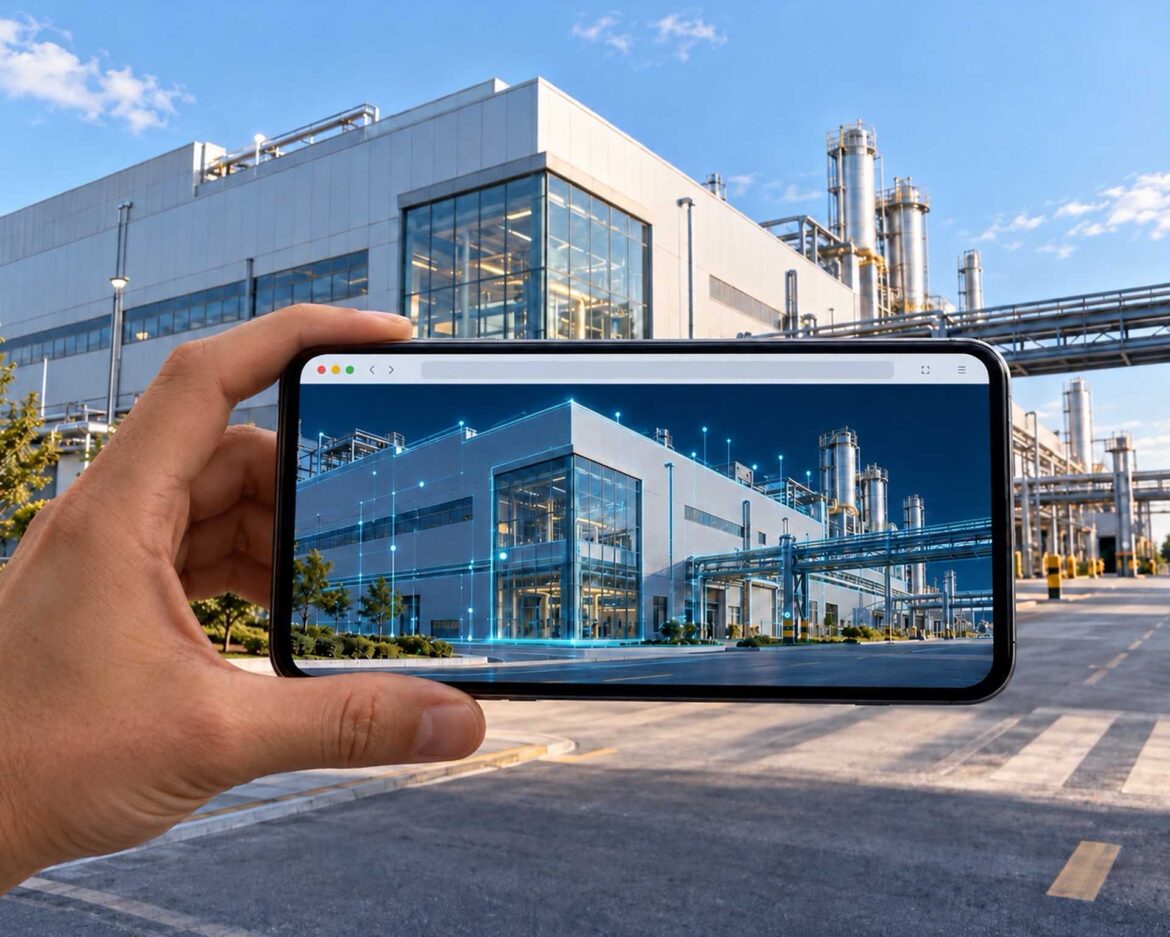
3D interfaces are becoming more accessible, and their value comes from the data behind them.
Visualization: An industrial campus in the browser only becomes a digital twin through connected operational data | Image: © Ulrich Buckenlei | XR Stager Online Magazine | VISORIC GmbH
An industrial campus seen from a bird’s-eye view, halls, roads and a runway, plus production figures, an event log and a view that zooms in on individual components and tolerances. This is what a video looks like that drew attention on social media in October 2026. What makes it special: the entire application runs as a single HTML file in an ordinary web browser.
The video shows a concept study. The figures displayed are simulated, and the campus is a vision. That is exactly what makes the example instructive. It shows how accessible spatial visualization has become, and it raises a question that matters to every industrial company: what turns a convincing 3D world into a digital twin that actually helps in operations?
The discussion under a post about the video on LinkedIn summed up the answer. The building blocks often already exist: 3D models, sensors, controllers, maintenance and order systems. The bottleneck lies in connecting them into a coherent system that lets people detect and understand problems earlier. Other voices stressed that geometry itself carries information and that a twin only counts when it enables action before production is affected.
For production managers, innovation departments and IT managers, this is an investment question. Anyone investing in a spatial interface today should know which parts of it are presentation and which are reliable information. This article examines the development step by step: from the concept in the browser through web graphics, integration and industrial standards to AI-assisted prototyping, measurable benefit and responsibility in operations. It also shows what a start looks like that begins small and delivers reliable results.
- An entire industrial campus now runs in a browser.
- The video shown is a concept study with simulated values.
- A digital twin needs a connection to the real plant.
- Integration is the real hurdle.
- A measurable pilot comes first.
The following article shows what a concept delivers, what makes a digital twin, why the browser is becoming a 3D platform, where integration and standards come in, what role AI plays and how a prototype becomes an accountable system.
A Factory That Exists Only in the Browser
The video looks like a digital tour of a running plant. The camera flies over the campus, moves into a hall and finally shows a single production cell with components and tolerances. Alongside it run counters, an event log and a drone view. What is shown is the concept of a fictional company as a single local HTML file in the browser.[1] The values are simulated, the infrastructure does not exist.
This very separation is what makes the example valuable. A campus does not have to be built for a planning question to become tangible. A team can discuss routes, relationships between halls, sight lines or possible production cells before the physical infrastructure exists. Management can compare orders of magnitude, a specialist department can talk about processes early on. The visualization becomes a shared space for discussion in which assumptions become visible and therefore testable.
At the same time, the interface tells more than the data supports. A dashboard that looks like real time is not yet a real-time measurement. An animated drone camera does not prove autonomous flight operations, and a precisely drawn production cell confirms neither its geometry nor its process data. Anyone assessing such a concept therefore first asks which elements are observed, which are modeled, which are simulated and which are purely decorative. This distinction determines which questions the concept can answer and which only a later stage of development will answer.
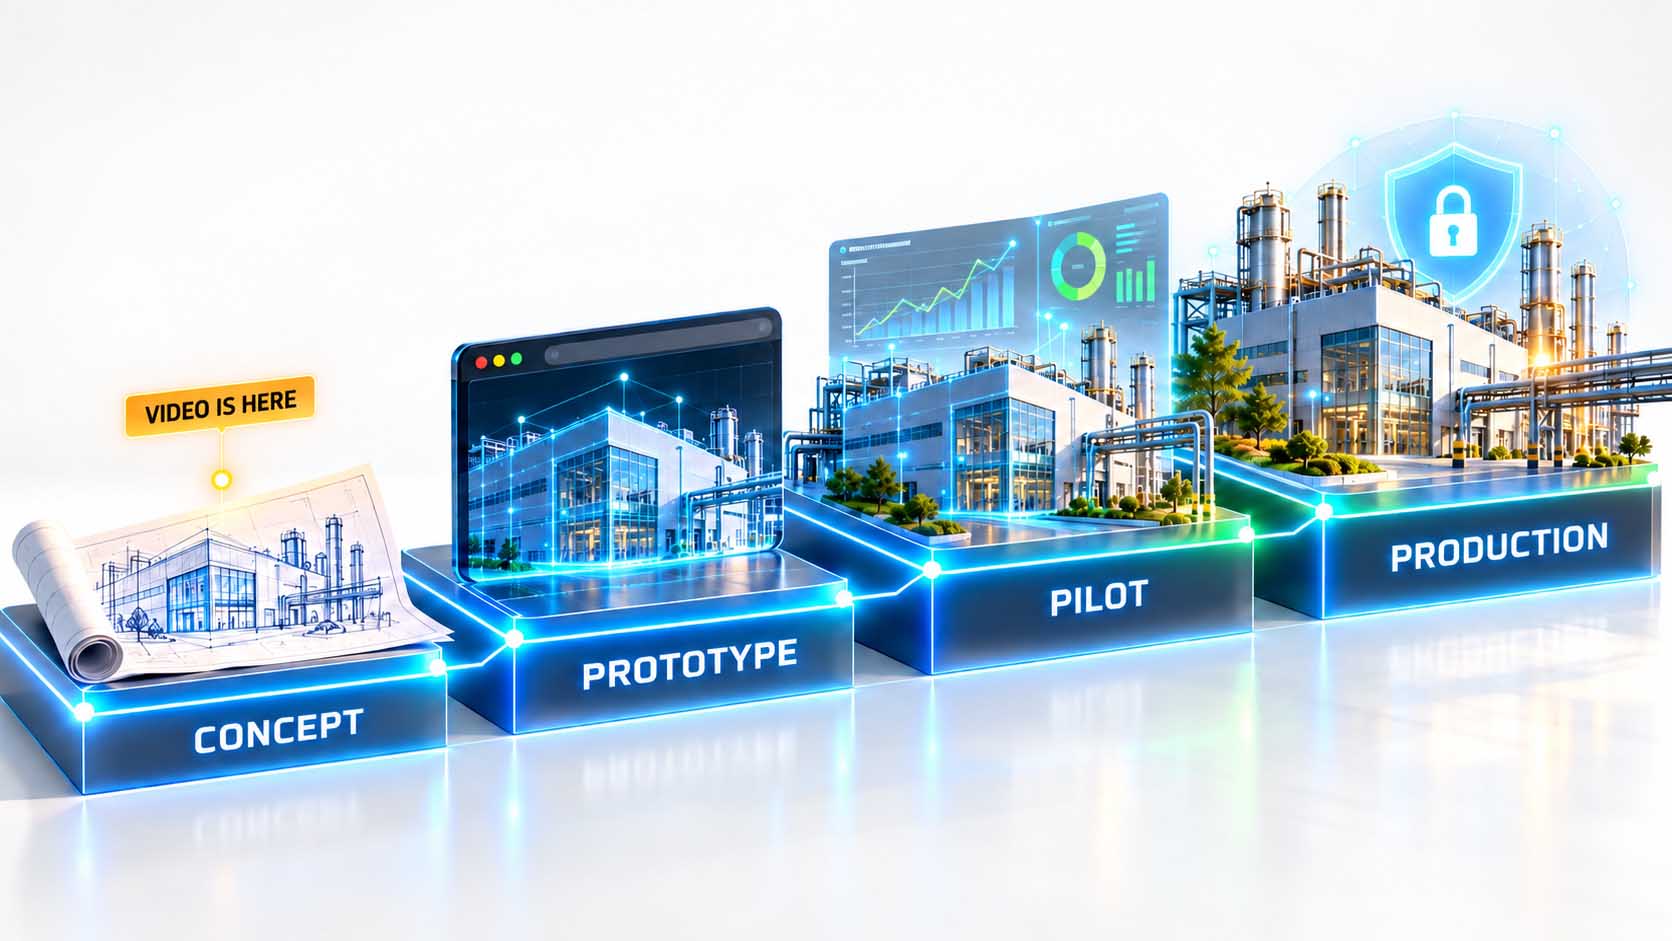
A convincing image stands at the beginning of the journey, not at the end.
Infographic: A concept makes assumptions visible, only pilot and operation connect it reliably to the real plant | Graphic: © Ulrich Buckenlei | XR Stager Online Magazine | VISORIC GmbH
For companies, a simple division into maturity levels helps. A concept makes spatial assumptions visible. A prototype tests whether users can work with it. A pilot connects selected real data. A production system additionally needs operation, access rights, monitoring and maintenance. These levels prevent a visually finished result from being classified as a technically integrated solution. The US National Institute of Standards and Technology, NIST for short, describes digital twins in manufacturing as synchronized virtual models of real systems that serve analysis, prediction or optimization.[2] An impressive image is a way into this discussion. The digital representation becomes reliable once its connection to the real counterpart and its purpose are established.
The real message of the video is therefore: the threshold for a convincing spatial prototype is falling. What used to be an expensive specialist application can now begin as a shareable browser experience. A simulation is valuable too, as long as it is labeled as a simulation and tests a hypothesis. The yardstick is then not the realism of every texture, but whether the model makes the right planning question understandable. The next chapter shows what turns a 3D image into a digital twin.
- The video shows an industrial campus as a single HTML file.
- The figures are simulated, the campus is a vision.
- Concepts make planning questions visible and debatable early on.
- Concept, prototype, pilot and production system are separate maturity levels.
- A model becomes reliable through connection and a clear purpose.
A concept in the browser is thus a strong start. Its value shows when its status is named honestly and its next stage is clearly planned.
A 3D Model Is Not Yet a Digital Twin
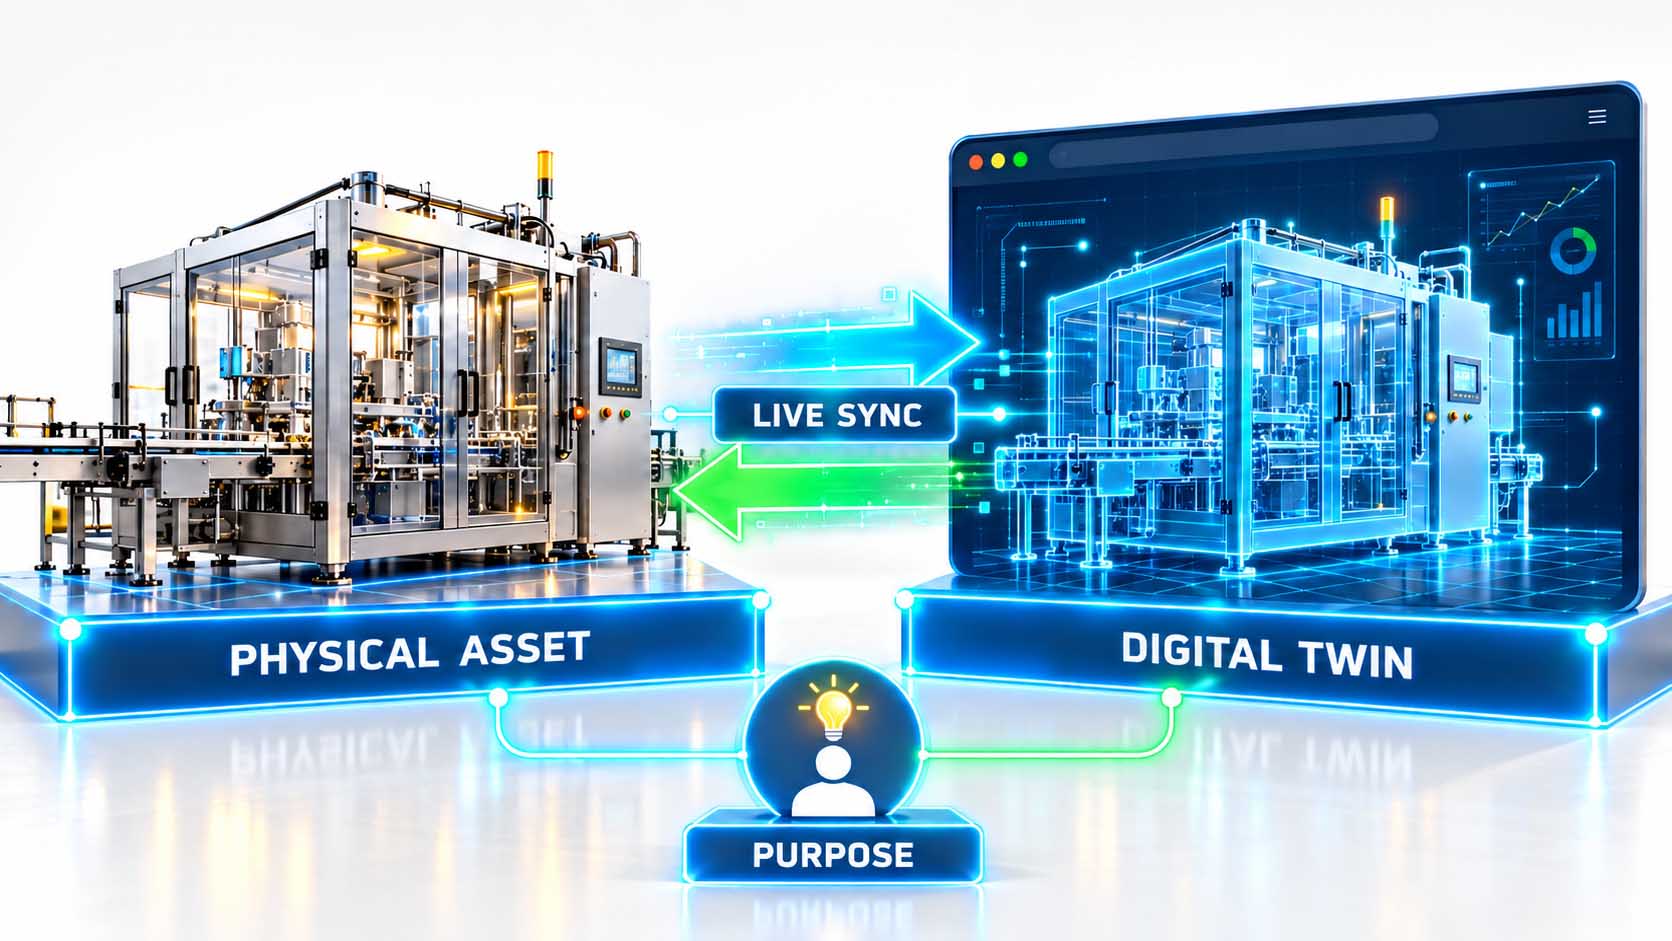
The term digital twin is used for very different things: for a CAD model, meaning a design model from engineering, for a 3D visualization, a simulation model, a dashboard or a continuously synchronized digital representation of a plant. These terms are not interchangeable. A model can be static. A simulation calculates possible states without continuously representing a specific plant. A dashboard shows measured values without placing them in space.
For manufacturing, the international standard ISO 23247 provides a helpful framework. It distinguishes between the observable manufacturing element, its digital representation, the connection between the physical and digital worlds and the users who use the twin for specific tasks.[3] The standard thus makes clear: it is not the 3D look that defines the twin, but the purpose-bound representation and the exchange of information with the real system.
In its work on digital twins in manufacturing, NIST emphasizes synchronization, data management and model validation.[4] This includes questions that remain invisible in a concept demo: how often is data updated? What delay is acceptable? What happens with missing or contradictory measurements? How does it become recognizable that a figure is simulated or outdated? The overview below the graphic classifies the most common terms.
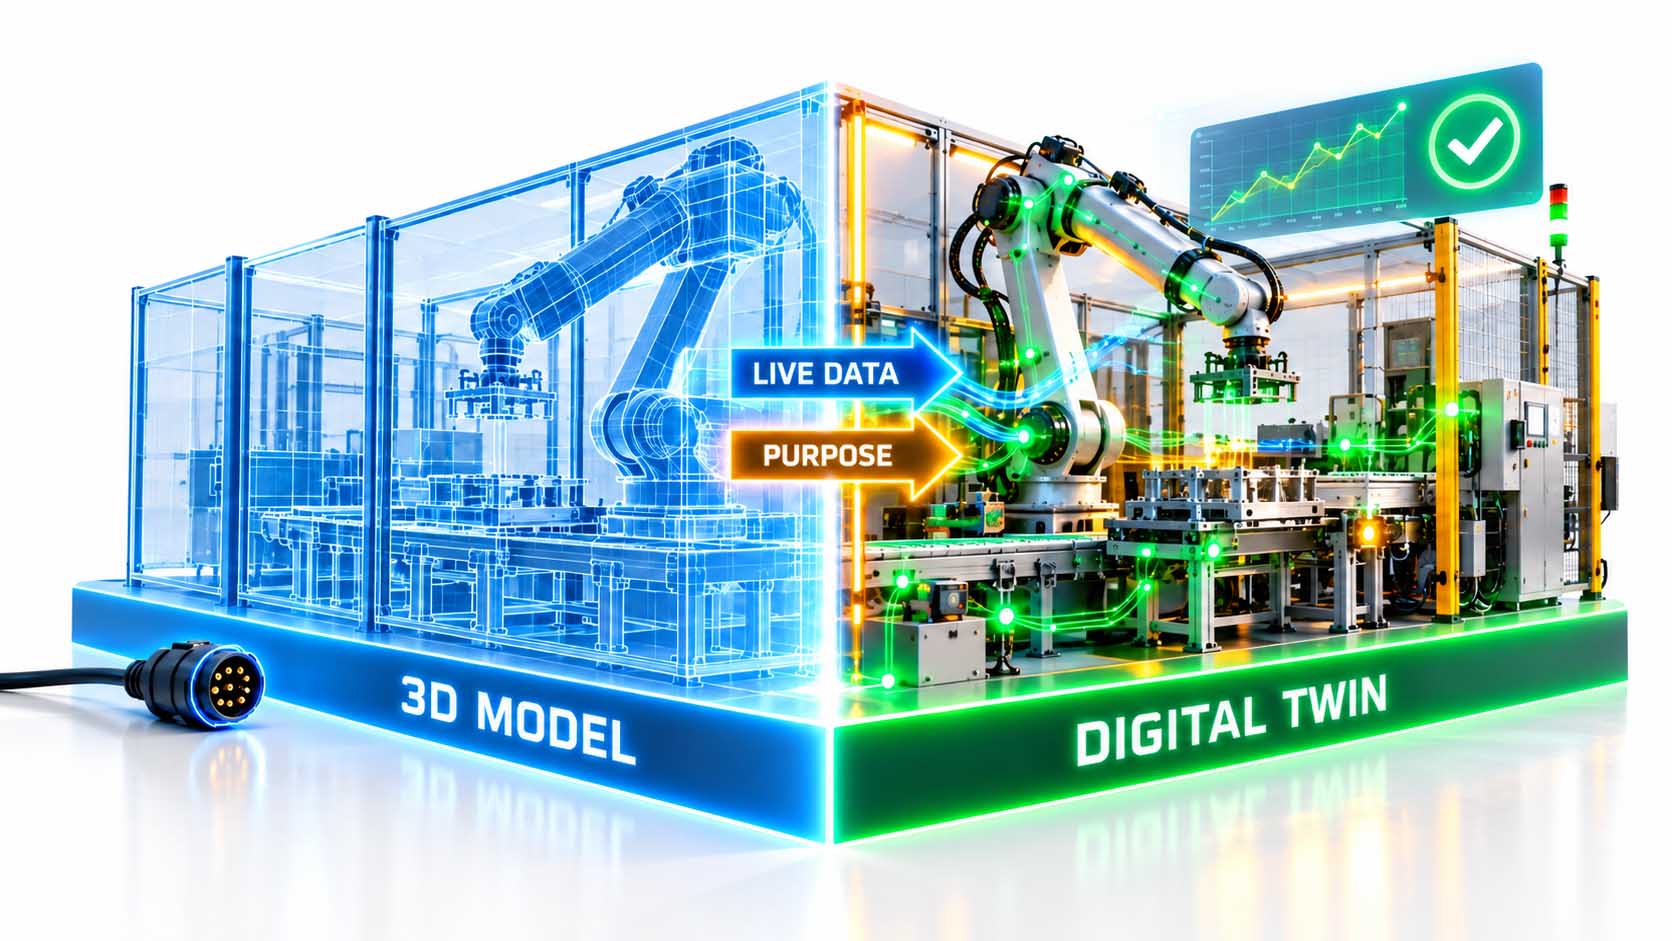
It is not the 3D look that makes the twin, but the connection to the plant.
Infographic: A digital twin emerges from a physical element, a digital representation, synchronization and a clear purpose | Graphic: © Ulrich Buckenlei | XR Stager Online Magazine | VISORIC GmbH
| Form | Shows | Connection to the plant | Typical purpose |
|---|---|---|---|
| CAD model | Geometry and structure | No ongoing connection | Design and manufacturing |
| 3D visualization | Space and appearance | None or one-time import | Communication and sales |
| Simulation | Possible states | Assumptions and parameters | Testing and planning variants |
| Dashboard | Key figures | Measured values without spatial reference | Monitoring |
| Digital twin | Location, meaning and state | Synchronized with the real plant | Decisions in operation |
Overview: Common forms of digital representation compared, own classification based on the cited standards and NIST work | Table: © Ulrich Buckenlei | XR Stager Online Magazine | VISORIC GmbH
For companies, the difference shows in a single display. A counter for output per day looks plausible in a draft. In operation, it needs a defined measure, a source, a time reference, a unit, a scope of validity and a responsible person. Are scrap and rework deducted? Does the value refer to the shift, the day or a rolling period? Without this information, the value remains a number on a screen. A good test is to deliberately interrupt the data connection once. A display that then remains unchanged must be marked as the last known state.
The prototype does not lose value as a result. It may be deliberately hypothetical as long as it is labeled as a hypothesis. The next chapter shows how the browser is becoming a platform for such prototypes.
- Model, simulation, dashboard and twin are different things.
- ISO 23247 defines the twin through connection and purpose.
- NIST emphasizes synchronization, data management and validation.
- Every figure needs a source, a time reference and a unit.
- Outdated values must be recognizable as outdated.
The decisive step is thus a cleanly defined transition from representation to observable reality, not more detail.
The Browser Becomes a 3D Platform
There is a technical reason why a single browser can display a plant that looks like industrial software. Modern web graphics use the device’s graphics card for rendering and computation. For this purpose, the World Wide Web Consortium, W3C for short, has defined WebGPU, a standardized programming interface that brings graphics and computing tasks directly to the graphics card.[5]
Libraries such as Three.js translate this technology into building blocks with which developers create scenes, cameras, lighting and interactions. Three.js offers its own WebGPU renderer, which falls back to the older WebGL 2 standard on devices without WebGPU support.[6] This makes demanding 3D scenes on the web realistic for significantly more applications.
The browser thus lowers an important hurdle. Nobody has to install specialist software for a first view. A link is enough to distribute a scene, collect feedback and make coordination easier. A prototype can be developed on a powerful workstation and presented on suitable devices. This is exactly what suits a campus concept that aims to show spatial orientation, figures and detail views at the same time.
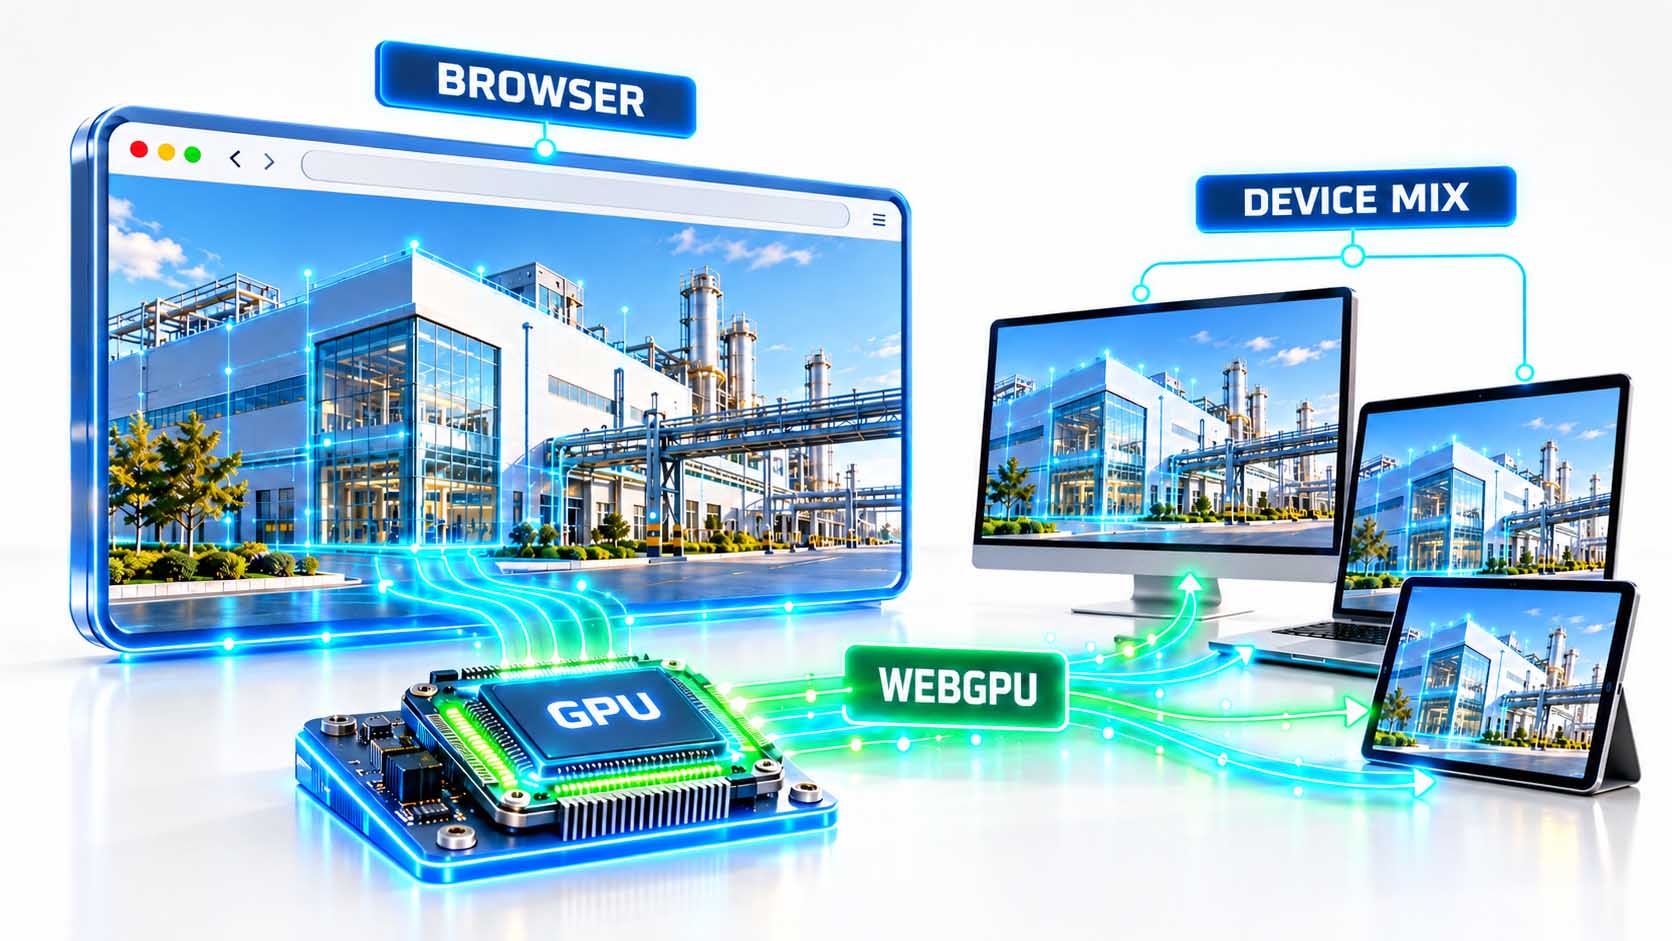
The browser opens the door, the device sets the pace.
Infographic: Web graphics lower the barrier to 3D, but devices, network and data volume still determine the experience | Graphic: © Ulrich Buckenlei | XR Stager Online Magazine | VISORIC GmbH
For companies, one point applies: what runs in the browser does not run the same everywhere. Graphics card, drivers, browser version, security settings, memory, network and screen size all affect the experience. A local HTML file can also load external libraries or data and is not the same as a centrally maintained web application with user rights, version control and operation. With large scenes, loading geometry step by step becomes important: tiles and graded levels of detail make a smooth experience possible but change the data architecture. A prototype should therefore be tested early on exactly the devices that will later be used in the plant or at the customer’s site. WebGPU offers more possibilities but is not an automatic switch for more performance in every scene. For robust distribution, fallback solutions, loading times, progressive levels of detail and a realistic device mix matter more than a single benchmark. Where highly detailed engineering models with precise measurement or simulation requirements are needed, a hybrid architecture combining a browser view with specialized tools can be the better choice.
The bigger change is organizational. When a 3D view becomes easy to share, more people talk about space and process earlier. However, the browser cannot guarantee where the data in this view comes from. That is the subject of the next chapter.
- WebGPU brings graphics and computing tasks to the graphics card.
- Three.js offers WebGPU with a fallback to WebGL 2.
- A link replaces the installation of specialist software.
- Devices, network and data volume determine the experience.
- Prototypes belong on the later target devices early on.
The browser thus makes spatial information more accessible than ever. The architecture behind it must secure its origin and meaning.
The Hard Part Is Integration
A digital campus is built from many data sources. Building geometry comes from BIM, the digital building model, or from CAD, machines from engineering systems, production states from controllers, maintenance information from maintenance management systems, orders from MES or ERP, meaning manufacturing and enterprise software. Add to this sensors, quality data and documents. These systems were built at different times, for different users and purposes. Each of them has its own names, its own update cycles and its own owners.
ISO 23247 therefore dedicates a separate part to the exchange of information.[7] This shows where the real work lies: a twin needs not only data transfer but suitable relationships between pieces of information. A machine value must be assignable to a specific plant, a location, a component and a valid time period. Standards structure this task but do not automatically solve every local data problem.
NIST names missing common terminology, a lack of interoperability and insufficient methods for checking models as central hurdles for digital twins.[4] In practice, these hurdles show up as seemingly small questions. Do two systems mean the same state when they say status? Do coordinate systems and scales match? Does a measured value belong to the machine or to the line? Which source applies when two systems report contradictory things?
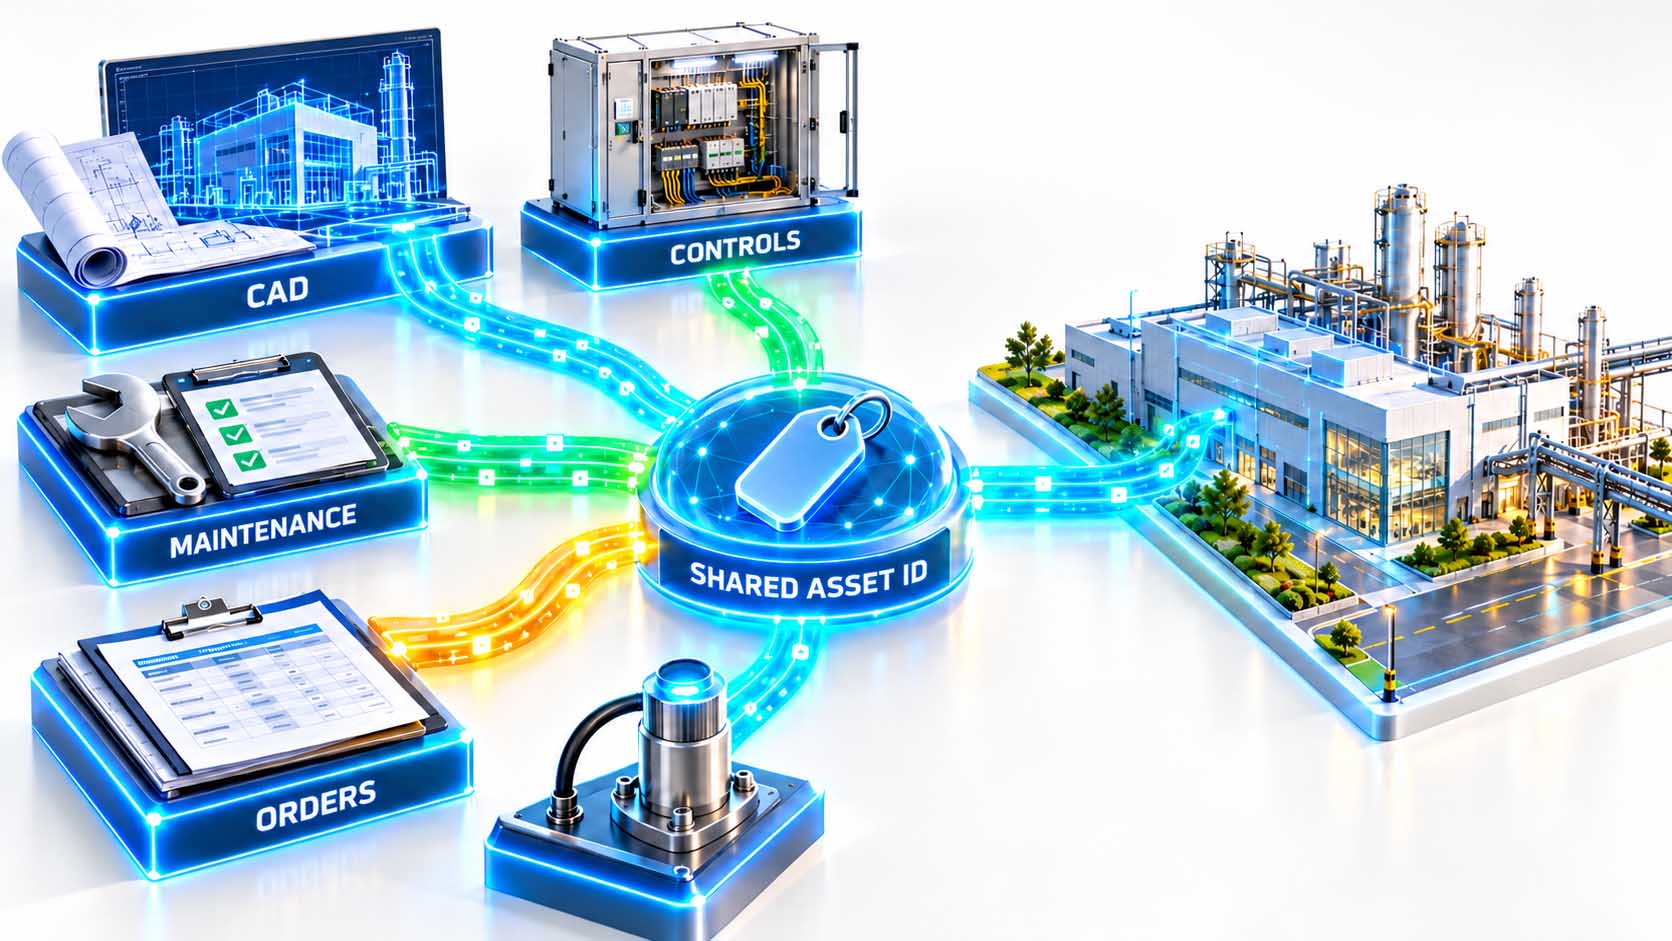
Integration connects systems through shared identities.
Infographic: A digital twin needs relationships between data, not just their transfer | Graphic: © Ulrich Buckenlei | XR Stager Online Magazine | VISORIC GmbH
In the discussion about the video, one comment captured the point: the building blocks often already exist, the limitation lies in integrating them into a coherent system. For companies, this does not mean moving all data into a central database. It means explicitly defining data flows, owners, update rules, identities and meanings. A distributed architecture can make sense as long as the connections remain traceable. Integration is also not a one-time import. Plants are rebuilt, sensors replaced and lines reassigned. If these changes do not flow back, the twin drifts further away from the plant step by step. For every data flow, it should be clear who provides it, which quality is checked and who responds to deviations.
Only once it is clear which decision should become faster or safer can one judge whether a connector, a programming interface or an adapter is the right form. Further questions belong here: what level of currency is sufficient? Who may correct data? Which failures are tolerable? A repeatable update process and a visible version status are part of integration, not administrative work after the fact. The next chapter shows how geometry and data acquire a shared meaning.
- A campus draws on many systems that have grown over time.
- ISO 23247 governs information exchange in a separate part.
- NIST names terminology, interoperability and validation as hurdles.
- Integration means relationships, not just transfer.
- Changes in the plant must flow back into the twin.
Integration is thus the stretch on which a beautiful view becomes a reliable tool.
Geometry and Data Need a Shared Meaning
The discussion about the video showed that the question of 3D model or data is framed too narrowly. One participant argued that geometry itself carries information: an accurate model, materials and structured component libraries are already data. Another put the emphasis on purpose: a twin counts when people detect problems earlier, understand their cause and can act before production is affected.
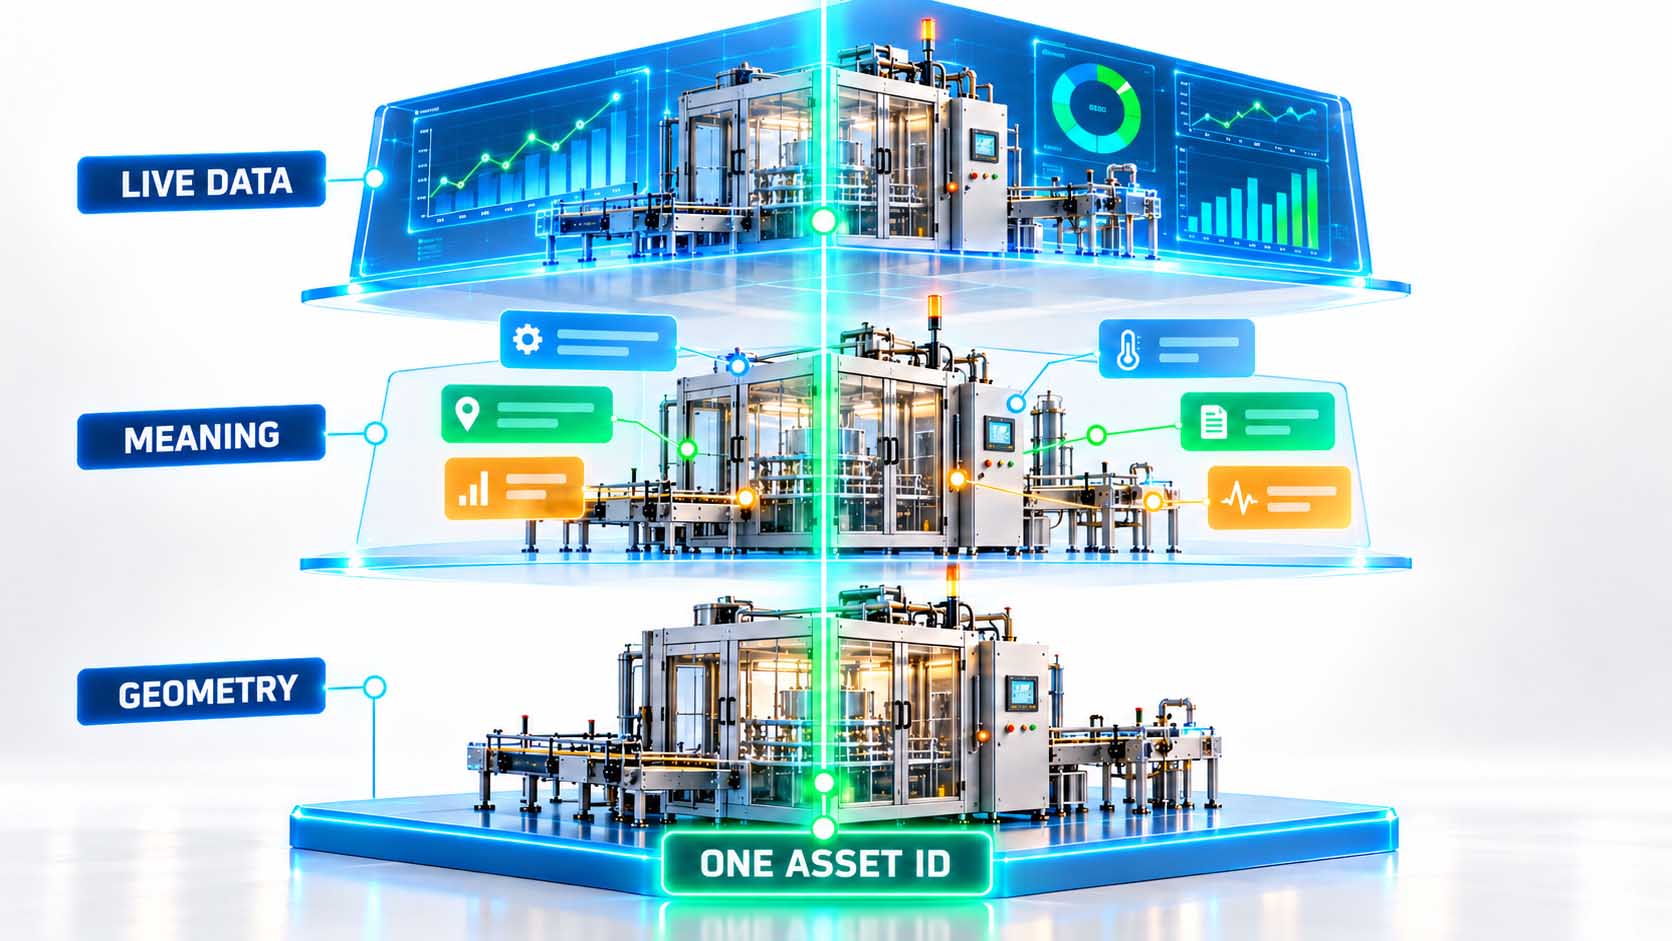
Both views belong together. Geometry says where something is and how components relate to each other in space. Semantics, meaning the meaning of things, says what an object is: machine, sensor, maintenance point, safety zone or order. Operational data says what is happening or has happened. A strong digital representation connects these layers instead of stacking them as separate overlays. Anyone who sees a warning then immediately recognizes which machine is affected, where it is located and which maintenance point needs to be checked next.
Industry has developed standards for this. The Asset Administration Shell of the Industrial Digital Twin Association provides a uniform information model for assets. Its submodels describe the properties of an asset in standardized templates.[8] OPC UA, a cross-platform communication standard of the OPC Foundation, governs data exchange between devices and systems.[9] Both approaches complement each other: one describes what a piece of information means, the other how it is transmitted.
Where, what and how it is running belong together.
Infographic: Geometry shows location, semantics shows meaning, operational data shows state, and only their connection produces reliable information | Graphic: © Ulrich Buckenlei | XR Stager Online Magazine | VISORIC GmbH
For companies, this does not mean introducing both standards completely right away. Existing interfaces, vendors and security rules determine the specific architecture. What matters are shared identities and units. An object called Cell 04 in the 3D scene must correspond to the same physical cell that has a unique identifier in the maintenance database. Otherwise, a vivid parallel world emerges without reliable information. Geometry also needs the right level of detail: a rough hall model is enough for an overview, collision checking for a robot needs higher precision, and for maintenance, part numbers and access zones matter more than photorealistic surfaces. Several purpose-specific views can be based on the same identifiers.
A clean data contract therefore documents which representation is approved for which decision. A precise engineering model is not automatically suitable for real-time display, large campus views or mobile devices, while simplified geometry is enough for an overview. The next chapter shows what role AI plays in building such applications.
- Geometry is itself a form of information.
- Semantics connects location, meaning and state.
- The Asset Administration Shell describes assets uniformly.
- OPC UA governs exchange between devices and systems.
- Shared identifiers prevent a parallel world.
Geometry, meaning and operational data thus only together provide the information that can support a decision in the plant.
AI Speeds Up the Prototype, Not the Truth
A code editor and an AI assistant can be seen on the screen in the video. Which tools created the campus and what share artificial intelligence had in it cannot be derived from this. The claim that an AI built this factory in a few hours would therefore be unsubstantiated. The more factual question is: which parts of such a prototype can be designed faster today?
AI programming assistants help create user interface elements, sample data, scripts and interactions. A controlled experiment by Microsoft Research, GitHub and MIT showed that developers using GitHub Copilot solved a clearly defined programming task significantly faster.[10] The form of this task matters: a short, well-defined test does not prove acceleration for complex, maintenance-intensive production software.
A randomized study by the research organization METR in 2025 came to the opposite result in a different setting. Experienced open-source developers working in large codebases they knew well took around 19 percent longer on average with AI assistance. The researchers emphasize that the result applies to this context.[11] Together, both studies show an important rule: the productivity effect depends on the task, experience, codebase and review effort. For an early prototype meant to make an idea quickly visible and debatable, AI can therefore be very helpful. For software that processes real plant values, the bar shifts to traceability and testability.
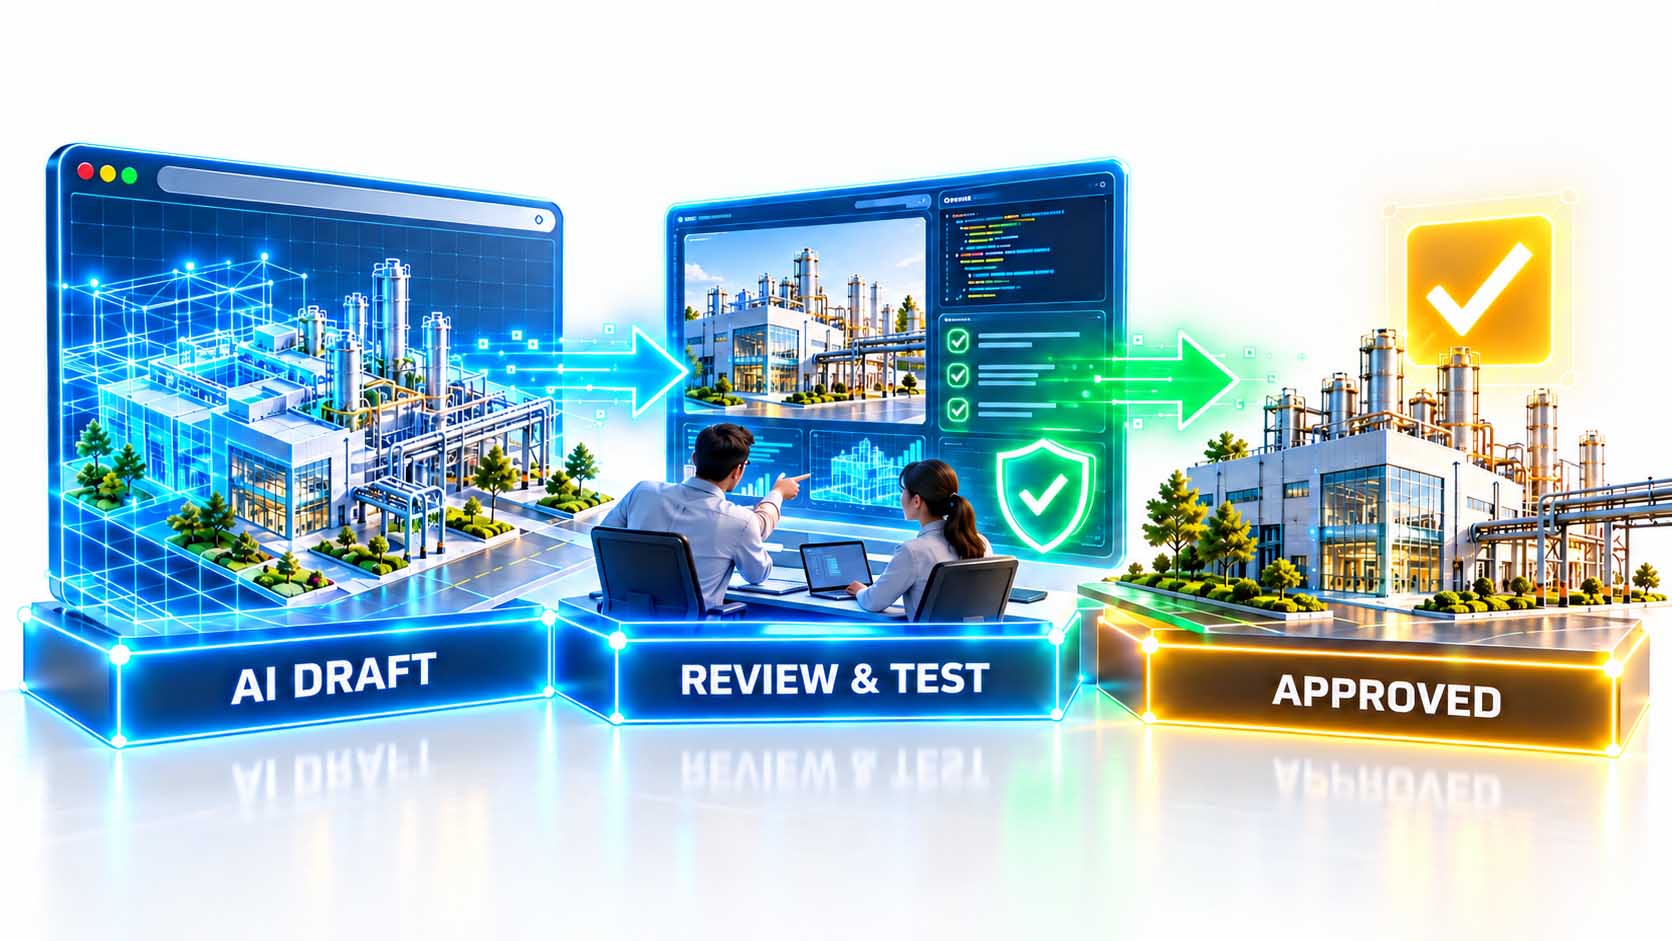
Faster to the draft, not faster to the truth.
Infographic: AI shortens the path to the first prototype, tests, review and professional approval remain separate steps | Graphic: © Ulrich Buckenlei | XR Stager Online Magazine | VISORIC GmbH
For companies, AI is thus an accelerator of individual work steps, not a guarantee of correctness. Generated code can contain wrong units, invented figures, insecure data access or structures that are hard to maintain. A seemingly working dashboard proves neither professional accuracy nor production readiness. Tests, code review, an access concept, a data model and accountability remain necessary. A fair assessment therefore measures not only how quickly the first draft was created, but also rework, error rate, code comprehensibility and the time to professional approval. At the same time, there is an advantage beyond speed: when a 3D view exists earlier, experts can formulate their expectations more concretely and correct wrong assumptions in time.
A well-designed workflow makes visible which components were generated automatically, which were reviewed and which were formally approved. The prototype thus becomes a shared tool for thinking. The next chapter shows how its benefit in operations can be measured.
- Which tools the video used is not documented.
- Copilot significantly sped up a clearly defined task.
- METR measured around 19 percent more time for experienced developers.
- The effect depends on the task, experience and review effort.
- Tests, review and approval remain human work.
The quality of a prototype is thus measured not by how independently an AI built it, but by how well it prepares the next decision.
The Twin Must Improve a Decision
A dashboard is not useful just because numbers move. The yardstick for a digital twin is its benefit for a work process: a fault is detected earlier, a cause is narrowed down, a maintenance job is better planned or an alternative process setting is tested. NIST describes digital twins in manufacturing as a basis for condition monitoring, fault detection, prediction and optimization, whose specific capabilities must be defined and verified for each use case.[4]
In the discussion about the video, this test was formulated precisely: a twin is valuable when it enables people to detect a problem earlier, understand its context and act before a production outage. This connects data with a question, a responsible role, a time window for action and a verifiable outcome.
Based on ISO 23247, NIST has published use case scenarios that show how implementation can be planned from the use case and the observable manufacturing elements.[12] For a digital campus, this results in a verifiable chain: a sensor reports a state, the state is assigned to an asset, the spatial view makes the location understandable, an analysis evaluates the deviation, a responsible person decides, and the effect of the measure is reported back. Only once this chain is closed does a display become a tool that saves time in everyday work.
The twin counts when it improves a decision.
Infographic: From signal to feedback, every transition must work for a twin to deliver measurable benefit | Graphic: © Ulrich Buckenlei | XR Stager Online Magazine | VISORIC GmbH
For companies, this means checking every transition in this chain. A signal can be delayed, a state misclassified, a notice too general to trigger an action. An employee may see a recommendation without being able to check or override it. A good demo therefore also shows which source produces a value, how certain the classification is and what response is possible. The evaluation needs a baseline: when is a deviation detected today, and when with the twin? Suitable metrics are time to diagnosis, the share of confirmed warnings, avoided downtime, search effort, false alarms and the number of cases in which users could follow a recommendation. These values should be collected with real user groups, because a technically correct system can still be unclear or too cumbersome at the workplace. When a spatial view is introduced, it is also possible to measure whether operators find an affected component faster and whether follow-up questions decrease.
A twin is successful when its effect compared to the previous process can be demonstrated. The next chapter shows what responsibility this requires in operations.
- The yardstick is the benefit for a specific work process.
- A twin helps detect and understand problems earlier.
- NIST shows use case scenarios based on ISO 23247.
- Every transition from signal to action can fail.
- Success is measured against a baseline.
Good pilot metrics thus measure not display quality but how much faster and more safely people decide.
From Prototype to Accountable System
In operation, a digital twin shows more than states. It connects analyses, predictions and recommendations with real consequences. Trust thus becomes a technical property. The NIST report IR 8356 addresses security and trust issues of digital twins and makes clear that risks affect the entire system: measurement technology, data channels, the digital representation and the interaction with the physical world.[13]
An accountable system therefore makes the origin, currency and uncertainty of data visible. It needs role and rights concepts, traceable changes and a clear separation between simulation and live data. When a view influences a decision, it must be recognizable which model version it is based on and whether a figure comes from measurement, calculation or assumption. A polished interface without this labeling can create false confidence.
Responsibility cannot be handed over to a model or an interface. In its standardization work, NIST describes interoperability, reliability and shared terminology as prerequisites for different systems to work together reliably.[14] Within the organization, it must also be clear who owns the physical plant, who is responsible for the digital representation, who changes data models, who approves new models and who responds when the system reports a deviation. These responsibilities sound like organization, but they are the prerequisite for a twin being used in an emergency rather than bypassed.
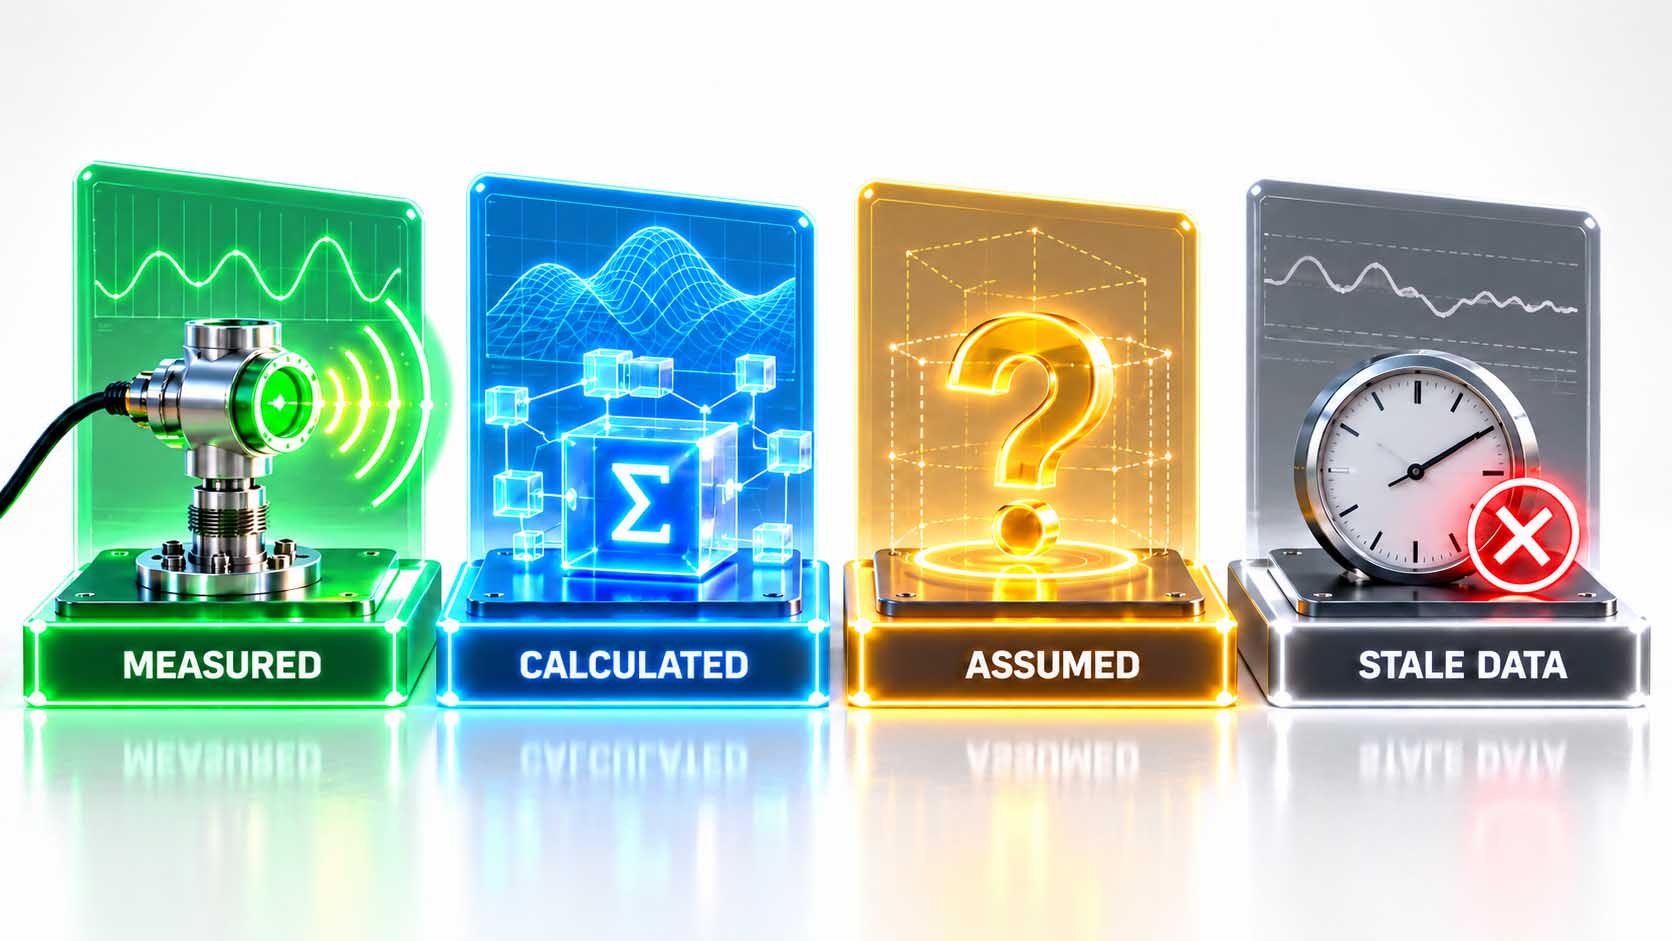
Every number needs its origin.
Infographic: An accountable system shows whether a value is measured, calculated or assumed and whether it is still current | Graphic: © Ulrich Buckenlei | XR Stager Online Magazine | VISORIC GmbH
For companies, this includes a safe fallback mode. A display must not look live when the connection is lost. A forecast must not appear as a measured state. Operators must be able to check, override and escalate recommendations. The more closely a twin is connected to planning or control, the more important verification, validation and the handling of uncertainty become. An operating concept also governs changes to software, data models and reference geometry: anyone introducing a new metric clarifies whether it remains comparable with earlier values. Anyone importing a new model knows which coordinates and identifiers have changed. And when external service providers are involved, data access, retention and deletion periods belong in the security architecture.
Such rules do not slow down innovation. They make results reproducible and accountable in operation. The campus in the browser is therefore a sensible start, as long as its status is named honestly. The following chapter shows how the video makes the starting question of this article visible.
- NIST IR 8356 considers risks across the entire system.
- Origin, currency and uncertainty must be visible.
- Simulation and live data remain clearly separated.
- Roles, rights and approvals are defined.
- A safe fallback mode protects against false confidence.
The next level of maturity thus comes from traceable connections between the visible world and the factory it is meant to represent.
The Factory in the HTML File on Video
The video is a concept study and not proof of a real plant. It shows a browser-based 3D view with halls, roads and a runway, dashboard elements with production values, an event log, a drone perspective and detail and cross-section views. The values are simulated, the infrastructure is a vision.[1]
The strongest moment lies in the change of scale. First the campus becomes visible as a whole, then the view leads into a hall and finally into a single production cell. This navigation shows why spatial interfaces are so convincing for complex plants. They make relationships visible that are hard to grasp in tables: neighborhoods, routes, sight lines and the location of an event.
The technical context is real, even if the campus is conceptual. WebGPU brings graphics and computing to the graphics card, and frameworks such as Three.js offer renderers with WebGPU and a fallback to WebGL 2.[5][6] This explains why demanding scenes are increasingly possible on the web. Whether the video itself uses WebGPU, a specific engine or AI-generated code cannot be inferred from it.
Video: Concept visualization of an industrial campus in a single HTML file, the figures are simulated | Visuals by original creators | Analysis, voiceover script, editorial work and video editing: © Ulrich Buckenlei | XR Stager Online Magazine | VISORIC GmbH
It is remarkable how naturally the video shows an experience that used to require specialized software and elaborate presentation setups. It is convincing as an example of rapid prototyping and spatial communication.
For context, it is equally important to note: the video does not allow one to verify whether values come from a controller, whether the drone is actually being controlled or whether the event log is based on real events. The clip shows the possible interaction, not the data pipeline behind it. Its real question is aimed at the next stage: which of the views shown could be connected to real, accountable operational data?
- The video shows a concept visualization with simulated values.
- The shift from campus to cell shows the strength of spatial interfaces.
- The web graphics behind it are real and available.
- Which tools were used is not documented.
- The next stage is the connection to real operational data.
The video makes visible what the chapters describe: the interface is ready, and the value comes from the data that connects it to the real factory.
You Know Your Plant, We Make It Spatially Understandable
A reliable digital twin arises from two kinds of knowledge. The company knows its plants, processes and the decisions that should become faster or safer. Implementation requires experience with 3D data, web graphics, interfaces and user interfaces that experts understand without lengthy training. This combination is at the core of the work of VISORIC GmbH.
For more than 15 years, the Munich-based expert team has been developing applications in 3D, AI and XR for companies ranging from mid-sized businesses to DAX-listed corporations. VISORIC supports companies from spatial visualization through data and interface architecture to the interactive pilot and brings everything together in the XR Stager platform, in the browser, on large displays or in XR.

Plant knowledge and technology knowledge together make a reliable pilot.
Image: The company contributes plant, process and decision, the expert team contributes 3D data, web technology and interfaces | © Ulrich Buckenlei | XR Stager Online Magazine | VISORIC GmbH
Getting started does not have to be big. A small but complete chain makes sense: one asset, suitable geometry, one data source, a specific decision and a responsible role. This chain is tested from the origin of the measured value to the documented response. It is agreed in advance what remains simulated, which data is missing and how outdated values are marked. Only once this small chain works reliably is it worth adding further machines, data types and user groups. In this way, the twin grows with demonstrable benefit instead of complexity. ISO 23247 provides a framework for manufacturing,[3] and NIST shows with its use case scenarios how requirements and verification can be planned from the use case.[12]
- Selecting a decision that should become faster or safer.
- Spatial view with data origin, status and currency.
- Pilot with real users, measured against the previous process.
Precisely because spatial prototypes are created so quickly today, now is a good time to put the first step on reliable data.
Which decision in your production should your digital twin improve?
Talk to the VISORIC expert team in Munich. Together, we carry out a reality check of your data, select a measurable use case and develop a pilot that shows what your digital twin can achieve.
Contact:
Email: info@visoric.com
Phone: +49 89 21552678
Sources and References
- Instagram reel by the account @abimaeel.silva, concept study Heimdall Industries, October 2026. Primary source for the concept visualization shown, identity, tools and implementation status not independently verified. instagram.com/abimaeel.silva.
- NIST. Definitions and State of the Art, Digital Twins Program, 2025. nist.gov/digital-twins/definitions-and-state-art.
- ISO 23247-2:2021. Automation systems and integration, Digital twin framework for manufacturing, Part 2, Reference architecture. iso.org.
- NIST. Digital Twins for Advanced Manufacturing. Project page on synchronization, data management, interoperability and validation. nist.gov/programs-projects/digital-twins-advanced-manufacturing.
- W3C. WebGPU, specification of a programming interface for GPU graphics and computation on the web. w3.org/TR/webgpu.
- Three.js. WebGPURenderer, documentation of the WebGPU renderer with fallback to WebGL 2. threejs.org/docs.
- ISO 23247-4:2021. Automation systems and integration, Digital twin framework for manufacturing, Part 4, Information exchange. iso.org/standard/78745.html.
- Industrial Digital Twin Association (IDTA). AAS Submodel Templates, standardized information models for asset data. industrialdigitaltwin.org.
- OPC Foundation. OPC Unified Architecture, cross-platform communication architecture for industrial interoperability. opcfoundation.org.
- Peng, S., Kalliamvakou, E., Cihon, P., Demirer, M. The Impact of AI on Developer Productivity. Evidence from GitHub Copilot. arXiv:2302.06590, 2023.
- Becker, J., Rush, N., Barnes, E., Rein, D. Measuring the Impact of Early-2025 AI on Experienced Open-Source Developer Productivity. METR, arXiv:2507.09089, 2025.
- NIST. Use Case Scenarios for Digital Twin Implementation Based on ISO 23247. AMS 400-2, 2021. doi.org/10.6028/NIST.AMS.400-2.
- NIST. IR 8356, Security and Trust Considerations for Digital Twin Technology, 2025. csrc.nist.gov/pubs/ir/8356/final.
- NIST. Digital Twin Standardization, overview of standardization work and interoperability barriers. nist.gov/digital-twins/digital-twin-standardization.
- VISORIC practical projects in the fields of digital twins, real-time 3D and spatial computing.
- XR Stager platform for real-time 3D, digital twins and industrial spatial computing applications.
Contact Persons:
Ulrich Buckenlei (Creative Director)
Mobile: +49 152 53532871
Email: ulrich.buckenlei@visoric.com
Nataliya Daniltseva (Project Manager)
Mobile: +49 176 72805705
Email: nataliya.daniltseva@visoric.com
Address:
VISORIC GmbH
Bayerstraße 13
D-80335 Munich